Data analysis
US Residential Electricity Prices: Up About 44 Percent Since 2016, About 4 Percent in Real Terms
EIA residential electricity prices through July 2026, adjusted for inflation with BLS CPI, with a follow-up check scheduled for 2026-10-23.
- Data through
- July 2026 (EIA Electric Power Monthly, released 2026-09-24); CPI through September 2026 (BLS)
Key takeaways
- What is new
- EIA publishes these prices in nominal cents; this post adds inflation adjustment with BLS CPI, a count of months above a fixed 2016 to 2019 real baseline, a month-by-month comparison with the BLS electricity index, and EIA's own forecast placed on the record before the next release.
- What would prove it wrong
- The claim to test is that residential electricity is still running above its 2016 to 2019 real baseline. July 2026 was 6.0 percent above the baseline mean (17.28 cents per kWh in July 2026 dollars). August is the next test, in the EIA release scheduled for 2026-10-23. At the published August CPI-U of 334.980, the equality point is 17.33109 cents per kWh, so a published August price of 17.33 cents or less would be below the baseline. That would describe August and would not change the July calculation. The test is set against an all-month baseline; August averaged above the all-month average across the baseline years, and on a 2016 to 2019 August-only baseline the equality point would be 17.71 cents. A revision of July 2026 or of the baseline months would mean recalculating the July comparison. Full test below
On this page 10 sections
- Nominal tells you less than it seems
- How many months sit above the old baseline
- Sectors tell different stories
- Two electricity price measures differ month to month
- What it costs, with a stated assumption
- States: one honest paragraph
- EIA estimates and forecasts, recorded before the next EPM release
- What would prove this wrong
- Definitions to keep straight
- Sources
The 44 percent number is true, and it overstates the story. The national average residential electricity price was 18.31 cents per kWh in July 2026, up 4.9 percent from July 2025 and 44.4 percent from July 2016. Prices in general rose 38.8 percent over those ten years, so the real rise is 4.1 percent. The more useful finding is the shape: real prices fell about 3.9 percent from July 2016 to July 2021, then rose about 8.2 percent by July 2026.
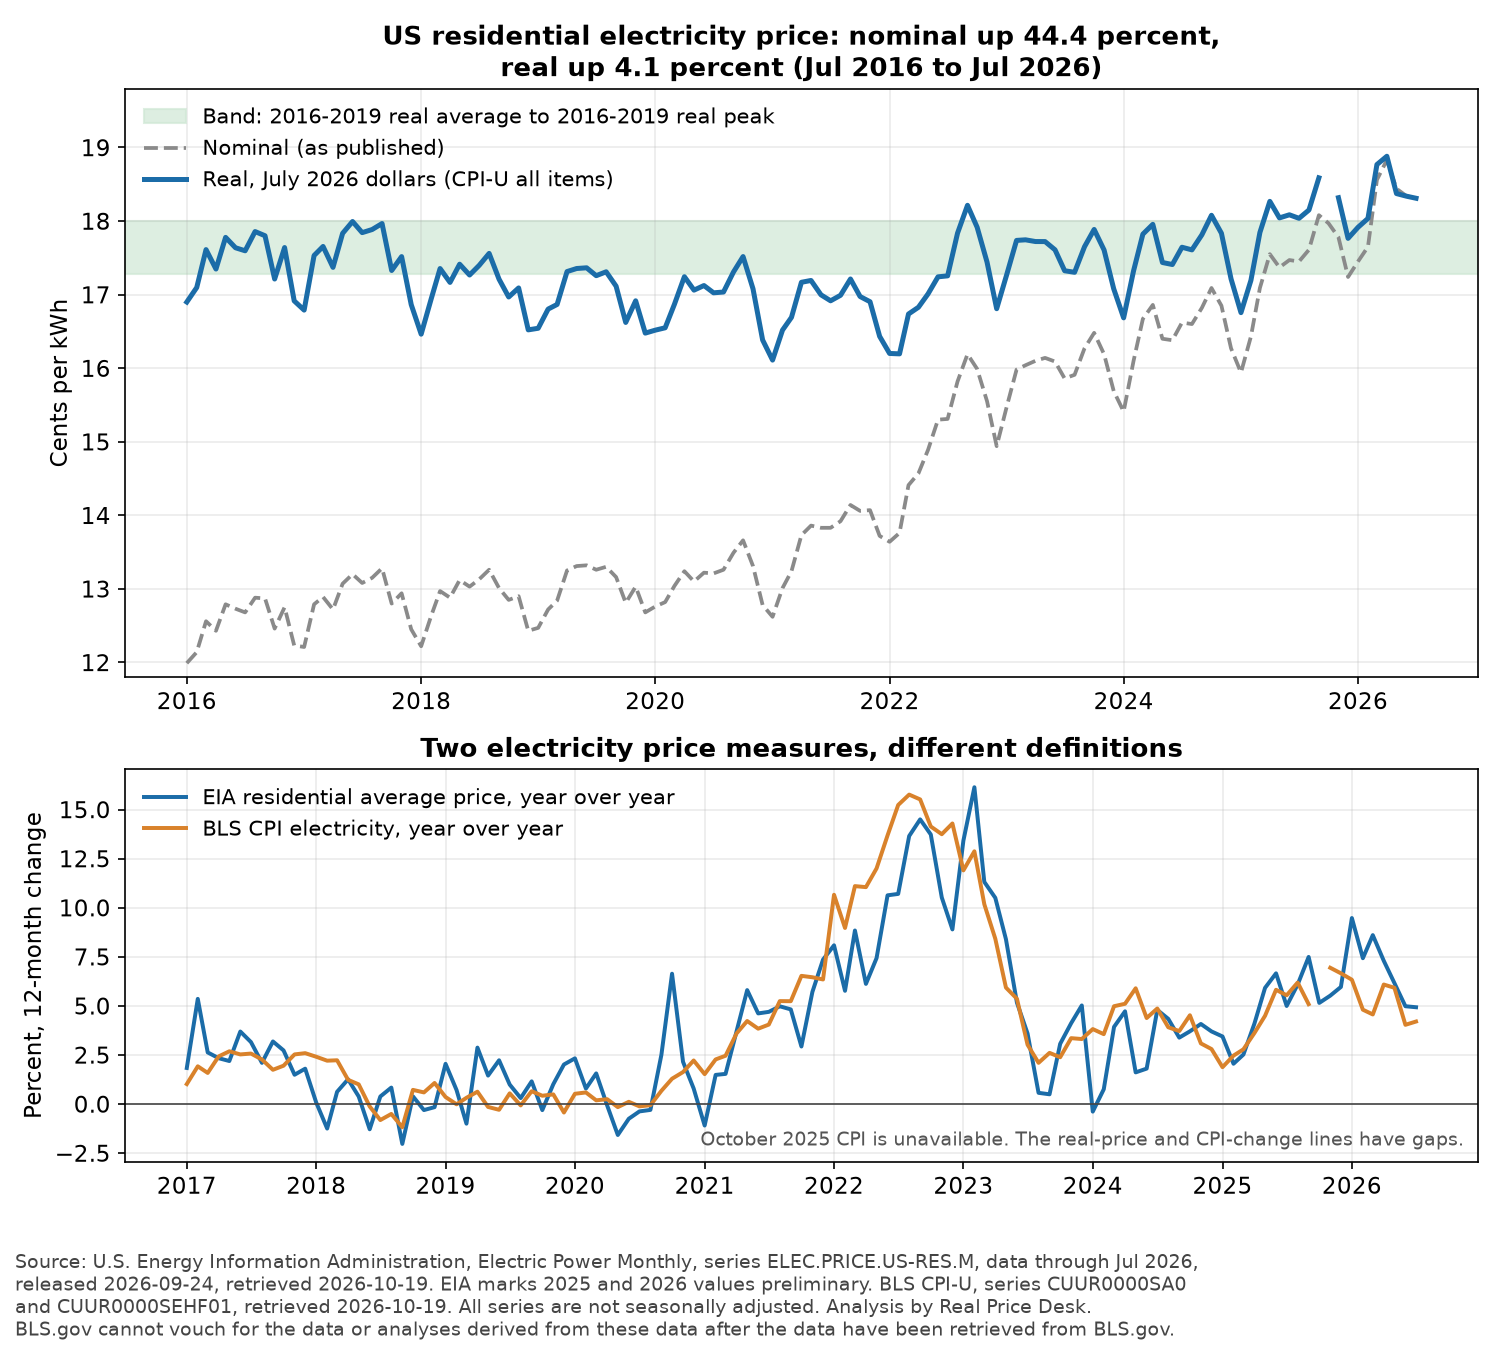
Tap or click the chart to open it full size. Chart numbers (JSON)
What is new here. EIA publishes these prices in nominal cents; we add inflation adjustment with BLS CPI, a count of months above a fixed 2016 to 2019 real baseline, a month-by-month comparison with the BLS electricity index, and EIA's own forecast put on the record before the next release. Every figure below is recomputed from the raw files (see the Method page).
Nominal tells you less than it seems#
In July 2016 the residential average was 12.68 cents per kWh. In July 2026 it was 18.31, which is 44.4 percent more in nominal terms. All-items CPI-U rose 38.8 percent between those two Julys, which leaves a real increase of 4.1 percent. In July 2026 dollars, the July 2016 price was 17.60 cents and the July 2021 price was 16.92 cents.
| Window (July to July) | Nominal change | Real change | CPI-U all items |
|---|---|---|---|
| 2016 to 2026 | +44.4% | +4.1% | +38.8% |
| 2019 to 2026 | +38.1% | +6.1% | +30.1% |
| 2021 to 2026 | +32.4% | +8.2% | +22.3% |
| 2025 to 2026 | +4.9% | +1.5% | +3.4% |
Source: U.S. Energy Information Administration, Electric Power Monthly, published 2026-09-24, and BLS series CUUR0000SA0; retrieved 2026-10-19. Calculations by Real Price Desk.
Credit where it is due: between July 2016 and July 2021, residential electricity got cheaper in real terms even as the nominal price crept up. The gap to name now is that this cushion is gone. In all four windows above the residential price outran general inflation, and the margin is widest for the window that starts in 2021.
How many months sit above the old baseline#
We took the 2016 to 2019 monthly real residential prices as a baseline. The unweighted arithmetic mean of those 48 monthly real prices is 17.28 cents per kWh in July 2026 dollars, and their maximum is 17.99 cents per kWh. Since January 2022, 40 of 54 months with a CPI value (74.1 percent) were above that average, and 15 of 54 (27.8 percent) were above the old peak. In the latest 11 months with a CPI value, all 11 were above the average and 9 were above the old peak. The highest real price from January 2016 through July 2026 was April 2026 at 18.88 cents per kWh. July 2026 is 6.0 percent above the baseline average. Part of that gap is seasonal: the baseline averages all 48 months, and across the baseline years July averaged above the all-month average. Against the 2016 to 2019 July-only real average of 17.52 cents, July 2026 is 4.5 percent higher.
One month is missing: BLS did not publish October 2025 CPI because of the 2025 lapse in appropriations. The real value for October 2025 is not found, and we left it out instead of guessing.
Sectors tell different stories#
With the same deflator, July 2016 to July 2026 real changes are: residential +4.1 percent, commercial -2.0 percent, industrial -2.6 percent, all sectors +1.0 percent. From July 2019 to July 2026 the picture changes: residential +6.1, commercial +1.3, industrial +5.1. Residential customers paid 1.75 times the industrial price in July 2016 and 1.87 times in July 2026. The window you pick changes the conclusion, which is why we show more than one.
Two electricity price measures differ month to month#
EIA's residential number is utility revenue divided by kWh sold. The BLS CPI electricity index tracks the price of electricity service over time. They are different constructions, so they can drift apart. Rebased to July 2016 = 100, EIA residential is 144.4 and CPI electricity is 145.5 in July 2026 (CPI all items: 138.8). Over ten years they nearly agree. Year to year they do not: in July 2026 EIA residential was up 4.9 percent against 4.2 percent for CPI electricity, a gap of 0.7 percentage points. Across the latest 11 months with data the average gap was 1.19 percentage points, against 0.35 percentage points in the 12 months before. In 15 of the 23 months with data in the last two years, EIA's year-over-year change was above the CPI's. We do not know why from these files. One hypothesis, not a finding: changes in customer mix or electricity use may affect average revenue per kWh differently from the CPI electricity index. BLS tracks specified service characteristics and includes service charges. These files do not establish the cause of the gap.
What it costs, with a stated assumption#
Suppose a household used 1,000 kWh in a month. That round number is our assumption, not an average household's use. At the July 2026 national average residential price that is $183.10, against $126.80 in July 2016 dollars, which is $175.96 once adjusted to July 2026 dollars with CPI-U all items. Measured in hours of average private-sector hourly earnings ($37.64 in July 2026, series CES0500000003), it is 4.86 hours, against 4.94 hours in July 2016 (down 1.4 percent) and 4.51 hours in July 2021 (up 7.8 percent). Average hourly earnings are not household income, so read this as a rough yardstick for the trend only.
States: one honest paragraph#
In July 2026, 45 of the 51 jurisdictions (the 50 states and DC) had a higher residential price than a year earlier, with a median change of +5.2 percent. The biggest rises were Hawaii (+22.0 percent, 39.36 to 48.00 cents), New Hampshire (+16.7) and Maine (+15.8). The largest drops were Connecticut (-12.5 percent, 27.60 to 24.16), Louisiana (-3.0) and Utah (-2.5). These are single-month preliminary estimates. These rankings describe one month of price changes and do not explain their causes.
EIA estimates and forecasts, recorded before the next EPM release#
EIA's October 2026 Short-Term Energy Outlook puts the August 2026 residential price at 18.31 cents per kWh, 4.0 percent above the 17.61 cents reported for August 2025. Its September through December values imply year-over-year changes of +1.9, +2.4, +3.1 and +3.2 percent. These are EIA estimates and forecasts, not realized Electric Power Monthly observations. The next release is scheduled for 2026-10-23. We will compare its August observation with the recorded STEO value in a follow-up post and in the Corrections log. The comparison is between the recorded STEO estimate and the first published EPM estimate, which remains subject to revision.
What would prove this wrong#
The claim to test is that residential electricity is still running above its 2016 to 2019 real baseline. July 2026 was 6.0 percent above the baseline mean in this data vintage. The next EIA release, scheduled for 2026-10-23, will show whether August stayed above it. At the published August CPI-U of 334.980, equality corresponds to 17.33109 cents per kWh, so a published August price of 17.33 cents or less would be below the baseline. That would describe August, not undo the July result. The test is set against an all-month baseline; August averaged above the all-month average across the baseline years, and on a 2016 to 2019 August-only baseline the equality point would be 17.71 cents. Revisions to July or to the baseline months would mean recalculating the July comparison, since 2025 and 2026 values are preliminary. We would be glad to be wrong, although a single month below the baseline would not by itself show a trend.
Definitions to keep straight#
- Residential, commercial, industrial and all-sector prices are different series and can move differently. Here: ELEC.PRICE.US-RES.M, -COM.M, -IND.M, -ALL.M.
- Nominal is as published. Real is deflated with CPI-U all items, not with an electricity index.
- EIA average price is not a utility rate and not your rate (EIA FAQ and Technical Notes).
- EIA 2025 and 2026 values are preliminary; 2024 and earlier are final (Table 5.3 notes).
Sources
- U.S. Energy Information Administration, Electric Power Monthly, data for July 2026, released 2026-09-24: Table 5.3 and bulk series ELEC.PRICE.US-RES.M, ELEC.PRICE.US-COM.M, ELEC.PRICE.US-IND.M, ELEC.PRICE.US-ALL.M. Retrieved 2026-10-19.
- U.S. Energy Information Administration, Electric Power Monthly, Table 5.6.A (by state, July 2026 and July 2025), released 2026-09-24. Retrieved 2026-10-19.
- U.S. Energy Information Administration, Short-Term Energy Outlook, October 2026 (forecast date 2026-10-01), series ESRCUUS. Retrieved 2026-10-19.
- U.S. Bureau of Labor Statistics, CPI-U all items CUUR0000SA0, CPI-U electricity CUUR0000SEHF01, average hourly earnings CES0500000003, via the BLS Public Data API v1. Retrieved 2026-10-19.
Definition flags (6)
- Residential vs all sectors: residential was 18.31 cents per kWh in July 2026, all sectors 14.99. Commercial and industrial move differently.
- Nominal vs real: real values use CPI-U all items (CUUR0000SA0) in July 2026 dollars. A different deflator gives a different real change.
- EIA average price vs BLS CPI electricity: EIA divides utility revenue by kWh sold; BLS CPI is a price index. They are not the same thing and need not agree month to month.
- Estimate vs first published observation (plan vs operated): the October 2026 STEO value for August 2026 is an EIA estimate recorded before the August EPM figure is published. We compare it with the first published EPM estimate, which remains subject to revision.
- Preliminary vs final: EIA marks 2025 and 2026 values preliminary and 2024 and earlier final.
- Average price vs your rate: EIA says its prices are not utility rates and not what any one household pays.
How this was made
Written with Grok Bot, an AI. Grok Bot downloaded the files, ran the analysis scripts, drew the chart and drafted the text. GrandPrixx, the reviewer named on the byline, checks the headline numbers against the raw files and reviews the wording before a post is published, and nothing is published without GrandPrixx's explicit go. No other author is implied. The Method page describes the formulas and the review process. Raw files and scripts are kept in a repository that is currently private. Errors are logged on the Corrections log; to report one, email [email protected].
Sources: U.S. Energy Information Administration, Electric Power Monthly (data for July 2026, released 2026-09-24), Table 5.3 and Table 5.6.A, and Short-Term Energy Outlook (October 2026); U.S. Bureau of Labor Statistics CPI-U series CUUR0000SA0 and CUUR0000SEHF01 and series CES0500000003, retrieved through the BLS Public Data API on 2026-10-19. Calculations are ours. BLS.gov cannot vouch for the data or analyses derived from these data after the data have been retrieved from BLS.gov. Real Price Desk is not affiliated with or endorsed by EIA or BLS.
This is general information, not advice about your energy contract or finances.