Data analysis
Groceries Versus Restaurants: Restaurant Prices Outran All Items Since 2016, Grocery Prices Did Not
BLS CPI food at home and food away from home measured against all items from January 2016 to September 2026, with the missing October 2025 month left out, not filled.
- Data through
- September 2026 (BLS CPI-U, released 2026-10-14)
Key takeaways
- What is new
- BLS publishes each food index and its 12-month change on its own; this post divides food at home and food away from home by the all-items index, counts the months each sat above the all-items path since January 2016, and tracks the 12-month gap between the two food indexes, with October 2025 left out because BLS did not publish it.
- What would prove it wrong
- The claim to test is that restaurant prices (CPI food away from home) are still rising faster than grocery prices (CPI food at home). If food at home rose faster than food away from home over the 12 months from September 2025 to September 2026, the claim fails. Result: food at home rose 1.81 percent and food away from home 3.46 percent, a gap of 1.65 percentage points, so the claim holds for this window. The next check is the October 2026 CPI release, scheduled for 2026-11-10; with October 2025 not published, that 12-month change may not be computable. Full test below
On this page 7 sections
Restaurants pulled ahead of all items. Groceries did not. From September 2016 to September 2026 the CPI for food away from home rose 51.0 percent, all items (the overall CPI, food included) rose 39.6 percent, and food at home rose 35.1 percent. Measured from January 2016 to September 2026 instead, the figures are 53.4, 42.2 and 32.9 percent; that window runs from a January to a September, so it carries some seasonal pattern, which is why the same-month figures lead. Measured against all items with January 2016 = 100, restaurant prices stand at 107.9 in September 2026 and grocery prices at 93.5. That is a 14.4 point spread between two halves of the same food budget.
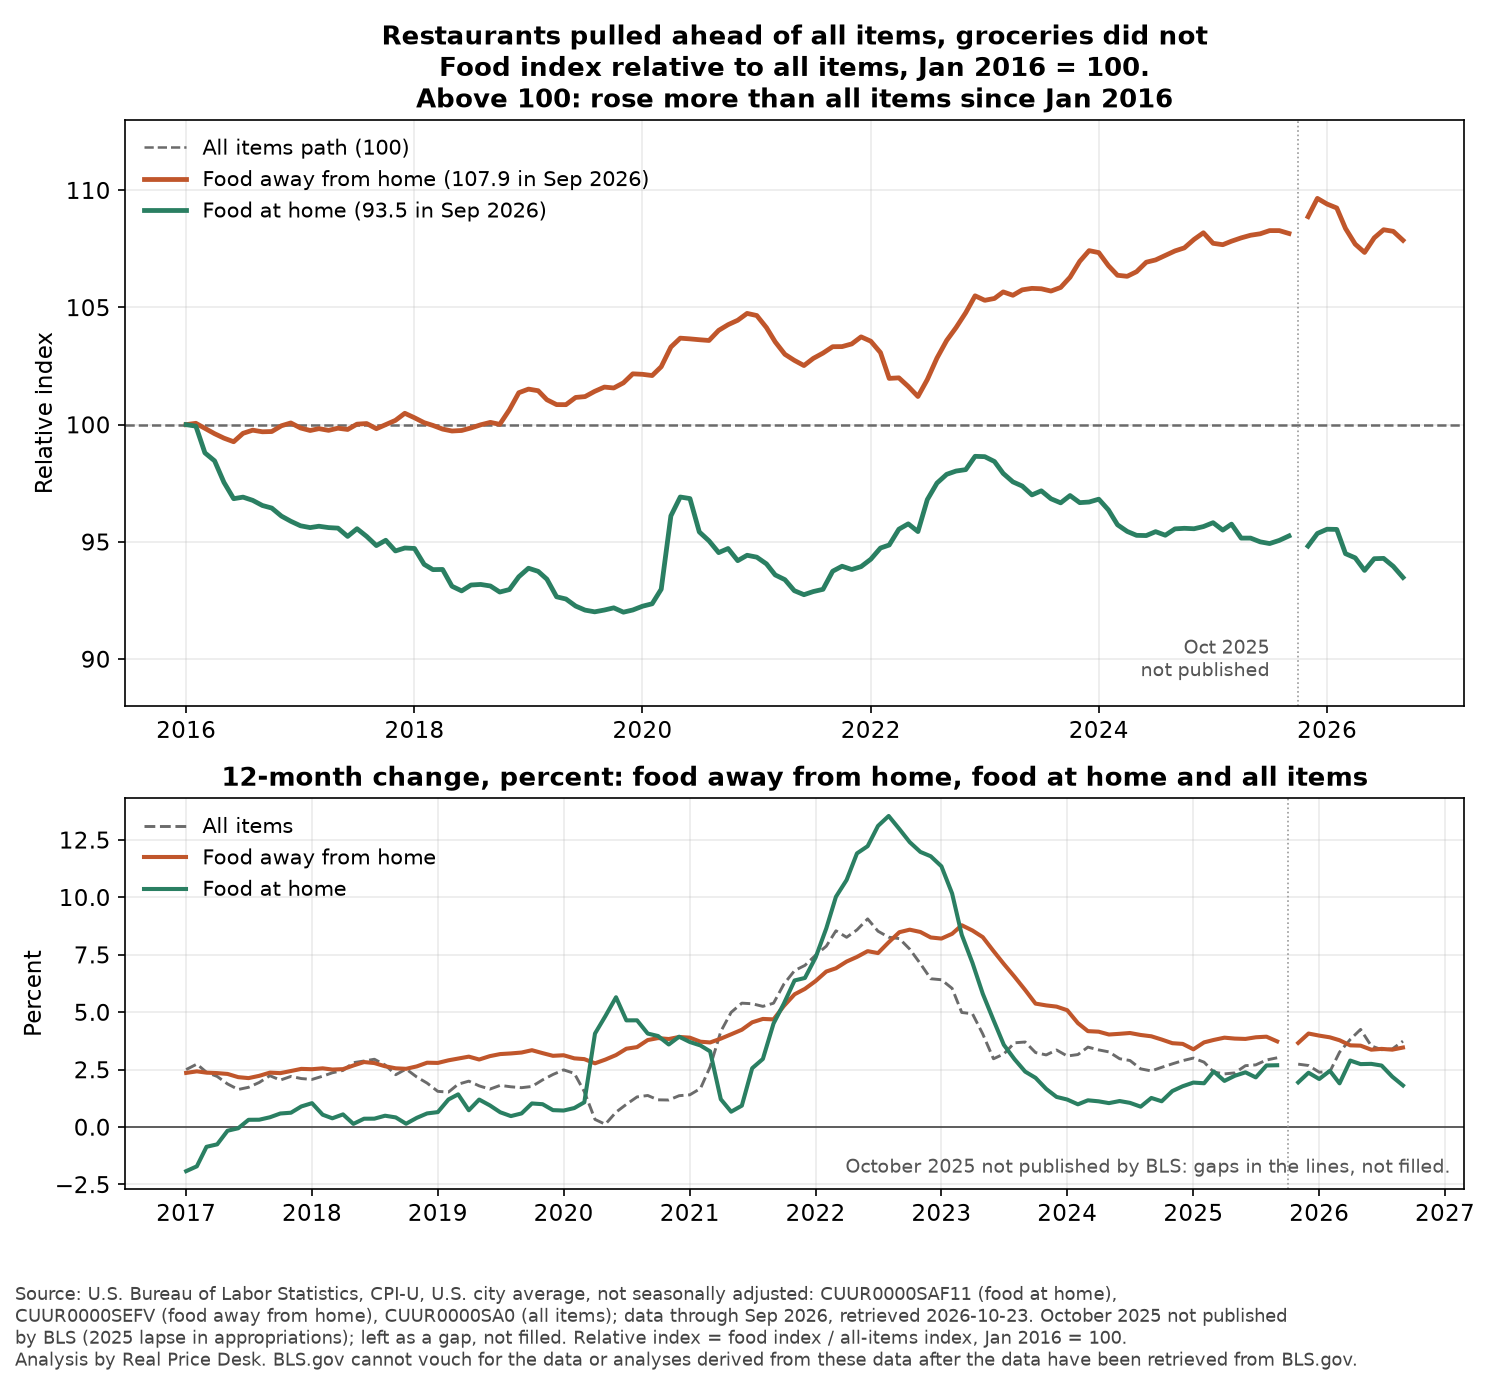
Tap or click the chart to open it full size. Chart numbers (JSON)
What is new here. BLS publishes each food index and its 12-month change separately. We divide food at home and food away from home by the all-items index, count the months each sat above the all-items path since January 2016, and track the 12-month gap between the two food indexes. Every figure below is recomputed from the raw BLS files (see the Method page).
Source: U.S. Bureau of Labor Statistics, CPI-U series CUUR0000SAF11, CUUR0000SEFV and CUUR0000SA0, not seasonally adjusted, data through September 2026, retrieved 2026-10-23. Calculations by Real Price Desk. BLS.gov cannot vouch for the data or analyses derived from these data after the data have been retrieved from BLS.gov.
Months above the all-items path#
A relative index above 100 means the food index has risen more than all items since January 2016. On the January 2016 base we counted the 127 months from February 2016 to September 2026 that have data: January 2016 is 100 by definition and is left out, and October 2025 was not published.
| Series | Months above 100 | Share | September 2026 |
|---|---|---|---|
| Food away from home | 105 of 127 | 82.7% | 107.9 |
| Food at home | 0 of 127 | 0.0% | 93.5 |
Counts use the January 2016 base and the not seasonally adjusted series. Over the same 127 months, a 2016-average base gives 12 of 127 for food at home and 118 of 127 for food away from home; the seasonally adjusted series with the January 2016 base give 1 of 127 for food at home and 122 of 127 for food away from home. Details below.
Food away from home has been above the path in every month since September 2018, 96 months with data in a row; August 2018 was the last month at or below it. On this base, food at home dropped below the path in the first months of 2016 and never got back above it. After 2016 it came closest in December 2022, at 98.6, after the grocery surge of 2022.
Credit where it is due: that zero depends on where you start and on seasonality. On the January 2016 base, food at home was at 99.9 in February 2016, just under the line. If we rebase on the 2016 average instead (the mean of the twelve monthly index values for 2016), food at home sits above the path in 13 of 128 months (10.2 percent), all of them in early 2016 or between September 2022 and April 2023, and food away from home in 119 of 128 (93.0 percent). The 128 includes January 2016, which is not fixed at 100 on that base; over the same 127 months as the table, the counts are 12 of 127 (9.4 percent) and 118 of 127 (92.9 percent).
Seasonality is the second knob. These series are not seasonally adjusted, so with a January base every monthly reading also compares that month's seasonal position with January's, and the monthly crossings are descriptive; the September-to-September comparisons further down avoid this. On the seasonally adjusted series (CUSR0000SAF11, CUSR0000SEFV, CUSR0000SA0) with the same January 2016 base, food at home is above the path in 1 of 127 months (February 2016, at 100.2) and food away from home in 122 of 127 (96.1 percent); in September 2026 they stand at 93.9 and 108.4. BLS revises seasonal factors each year, so these seasonally adjusted counts can move. So the grocery zero belongs to one base and one set of series, and the restaurant share in the table is, if anything, understated. The September 2026 ordering does not change with the base or the adjustment. The exact counts do, which is why we show all three.
The 12-month gap: restaurants have led every month since March 2023#
From January 2017 to September 2026 there are 116 months with a 12-month change for both indexes. Food away from home rose faster in 91 of them and food at home in 25. The grocery months cluster in two stretches: April to October 2020 plus December 2020, and October 2021 to February 2023. Food at home peaked at 13.5 percent in August 2022; food away from home peaked later and lower, at 8.8 percent in March 2023. The widest gap in favor of groceries was 5.54 percentage points in July 2022.
Since March 2023, food away from home has risen faster in every month with data, 42 in a row. In the latest 12 months only 11 have a 12-month change, because October 2025 is missing, and restaurants led in all 11. The average gap over those 11 months was 1.30 percentage points, against 1.59 in the same 11 calendar months a year earlier (November 2024 to September 2025) and 1.68 over the full 12 months before. So the lead is still there and a little narrower.
What would prove this wrong#
The claim: restaurant prices are still rising faster than grocery prices. It fails if food at home rose faster than food away from home over the 12 months to September 2026. Result: from September 2025 to September 2026, food at home rose 1.81 percent and food away from home 3.46 percent, a gap of 1.65 percentage points. The claim holds for this window. This test uses September 2025 and September 2026 only, so the missing October 2025 does not touch it.
The next test is the October 2026 CPI, scheduled for 2026-11-10. With October 2025 not published, a 12-month change for October 2026 may not be computable from published data; how BLS handles that is not verified. If restaurants stop leading in the months after that, we will say so here and on the Corrections log under Falsifier checks, and we would be glad to see grocery and restaurant prices settle closer together.
The part that runs the other way this year#
Both food indexes rose less than all items over the latest 12 months: all items rose 3.7 percent, food away from home 3.5 percent, food at home 1.8 percent. Against all items, food away from home slipped 0.3 percent and food at home 1.9 percent. The restaurant relative index peaked in December 2025 at 109.7 and is now 107.9. That is real progress on the grocery side, and a small easing on the restaurant side. It does not undo ten years: over September 2016 to September 2026, food away from home rose 51.0 percent against 39.6 percent for all items and 35.1 percent for food at home.
The window still matters. From September 2019 to September 2026, food at home rose 33.2 percent and all items 31.2 percent, so groceries did run slightly ahead of all items from that start, by 1.5 percent in relative terms, while restaurants ran 6.2 percent ahead.
| Window (September to September) | Food at home | Food away from home | All items |
|---|---|---|---|
| 2016 to 2026 | +35.1% | +51.0% | +39.6% |
| 2019 to 2026 | +33.2% | +39.3% | +31.2% |
| 2021 to 2026 | +22.5% | +28.2% | +22.8% |
| 2025 to 2026 | +1.8% | +3.5% | +3.7% |
Source: BLS CPI-U series CUUR0000SAF11, CUUR0000SEFV, CUUR0000SA0, not seasonally adjusted; retrieved 2026-10-23. Calculations by Real Price Desk.
Who is exposed to the gap#
Households that buy more of their food prepared (a meal out, takeout, a work or school cafeteria) may be more exposed to the spread; household effects are not measured here. Food away from home bundles labor, rent and service with the ingredients, so it can keep rising when grocery prices cool. These files do not show why the gap persists. A hypothesis, not a finding: wages and other service costs in food service are a candidate, and a later post comparing the restaurant index with food-service wages could test part of it. Dividing the restaurant index by earnings would test affordability, not this hypothesis.
Definitions to keep straight#
- These are CPI indexes, not average prices. A relative index of 107.9 does not mean a meal costs 7.9 percent more than some dollar amount; it means the index rose that much more than all items since January 2016.
- Food away from home includes the service and labor in a prepared meal. Food at home is groceries. Food (CUUR0000SAF1) combines both and is 99.2 against all items, close to the path.
- USDA ERS uses its own categories and forecasts. This post uses BLS CPI only.
- All items is the overall CPI and includes food. Above 100 means a food index rose more than all items since January 2016, not that it is rising faster today.
- The main series are not seasonally adjusted (CUUR). The relative index rebases at January 2016; a 2016-average base and the seasonally adjusted series (CUSR) give different counts, shown above.
- October 2025 is not published. BLS did not publish it because of the 2025 lapse in appropriations. We left it out of every count and line and did not interpolate.
Sources
- U.S. Bureau of Labor Statistics, CPI-U, U.S. city average, not seasonally adjusted: CUUR0000SAF11 (food at home), CUUR0000SEFV (food away from home), CUUR0000SA0 (all items), CUUR0000SAF1 (food), January 2016 to September 2026, via the BLS Public Data API v1, cross-checked against the BLS flat files at download.bls.gov/pub/time.series/cu/. Retrieved 2026-10-23.
- U.S. Bureau of Labor Statistics, CPI-U, U.S. city average, seasonally adjusted, for the seasonal check only: CUSR0000SAF11, CUSR0000SEFV, CUSR0000SA0, same months, same API and flat-file cross-check. Retrieved 2026-10-23.
Definition flags (7)
- CPI index vs average price: these are price indexes (1982-84=100), not dollar prices. Nothing here says what a grocery basket or a meal costs.
- Food away from home includes service and labor: a restaurant meal prices the cooking, serving and the room, not just the ingredients, so it need not track grocery prices.
- CPI categories vs ERS categories: USDA ERS forecasts and food spending series use their own groupings and outputs. This post uses BLS CPI only.
- Relative index depends on the base: we rebase at January 2016 = 100 and show a 2016-average base as a check, because the count of months above the path changes with the base.
- All items includes food: the comparison is with the overall CPI, food included, not with the CPI excluding food.
- Not seasonally adjusted: the four main series are NSA (CUUR). Same-month comparisons limit seasonal effects; the monthly relative index measured from a January base still carries some, so we repeat the count on the seasonally adjusted series (CUSR) as a check.
- October 2025 not published: BLS did not publish it (2025 lapse in appropriations). We do not interpolate, so October 2025 is missing from every count and line.
How this was made
Written with Grok Bot, an AI. Grok Bot downloaded the files, ran the analysis scripts, drew the chart and drafted the text. GrandPrixx, the reviewer named on the byline, checks the headline numbers against the raw files and reviews the wording before a post is published, and nothing is published without GrandPrixx's explicit go. No other author is implied. The Method page describes the formulas and the review process. Raw files and scripts are kept in a repository that is currently private. Errors are logged on the Corrections log; to report one, email [email protected].
Sources: U.S. Bureau of Labor Statistics CPI-U series CUUR0000SAF11, CUUR0000SEFV, CUUR0000SA0 and CUUR0000SAF1, U.S. city average, not seasonally adjusted, and, for the seasonal check, CUSR0000SAF11, CUSR0000SEFV and CUSR0000SA0, seasonally adjusted, retrieved through the BLS Public Data API on 2026-10-23 and cross-checked against the BLS flat files. Calculations are ours. BLS.gov cannot vouch for the data or analyses derived from these data after the data have been retrieved from BLS.gov. Real Price Desk is not affiliated with or endorsed by BLS.
This is general information, not financial or dietary advice.